 Claude
 ChatGPT
 Gemini
You post something on LinkedIn, and it does well. You got decent impressions, a healthy engagement rate, and comments rolling in all afternoon.
Then a month goes by, and nothing meaningful comes from it. There are no inbound messages, no introductions to potential investors, and no candidates mentioning the post during an interview. The numbers looked good, but they weren't necessarily measuring what mattered to your business.
That's the trap with LinkedIn analytics. It's easy to optimize for numbers that look good on a dashboard and never check whether they're connected to the outcomes you're actually trying to achieve.
This guide covers every metric worth your attention, where to find each one, what changed in how LinkedIn decides who sees your content, and how to tell whether your presence on the platform is working.
Your Profile and Your Company Page Are Different
Before you look at the numbers, make sure you know which dashboard you're using. Your personal profile and company page serve different purposes, so their analytics are best read separately.
Personal profiles often see stronger engagement than company pages, partly because people tend to respond more naturally to posts from individuals. In 2026, personal profiles average around 3.85% engagement, compared with 2.1% for Company Pages.
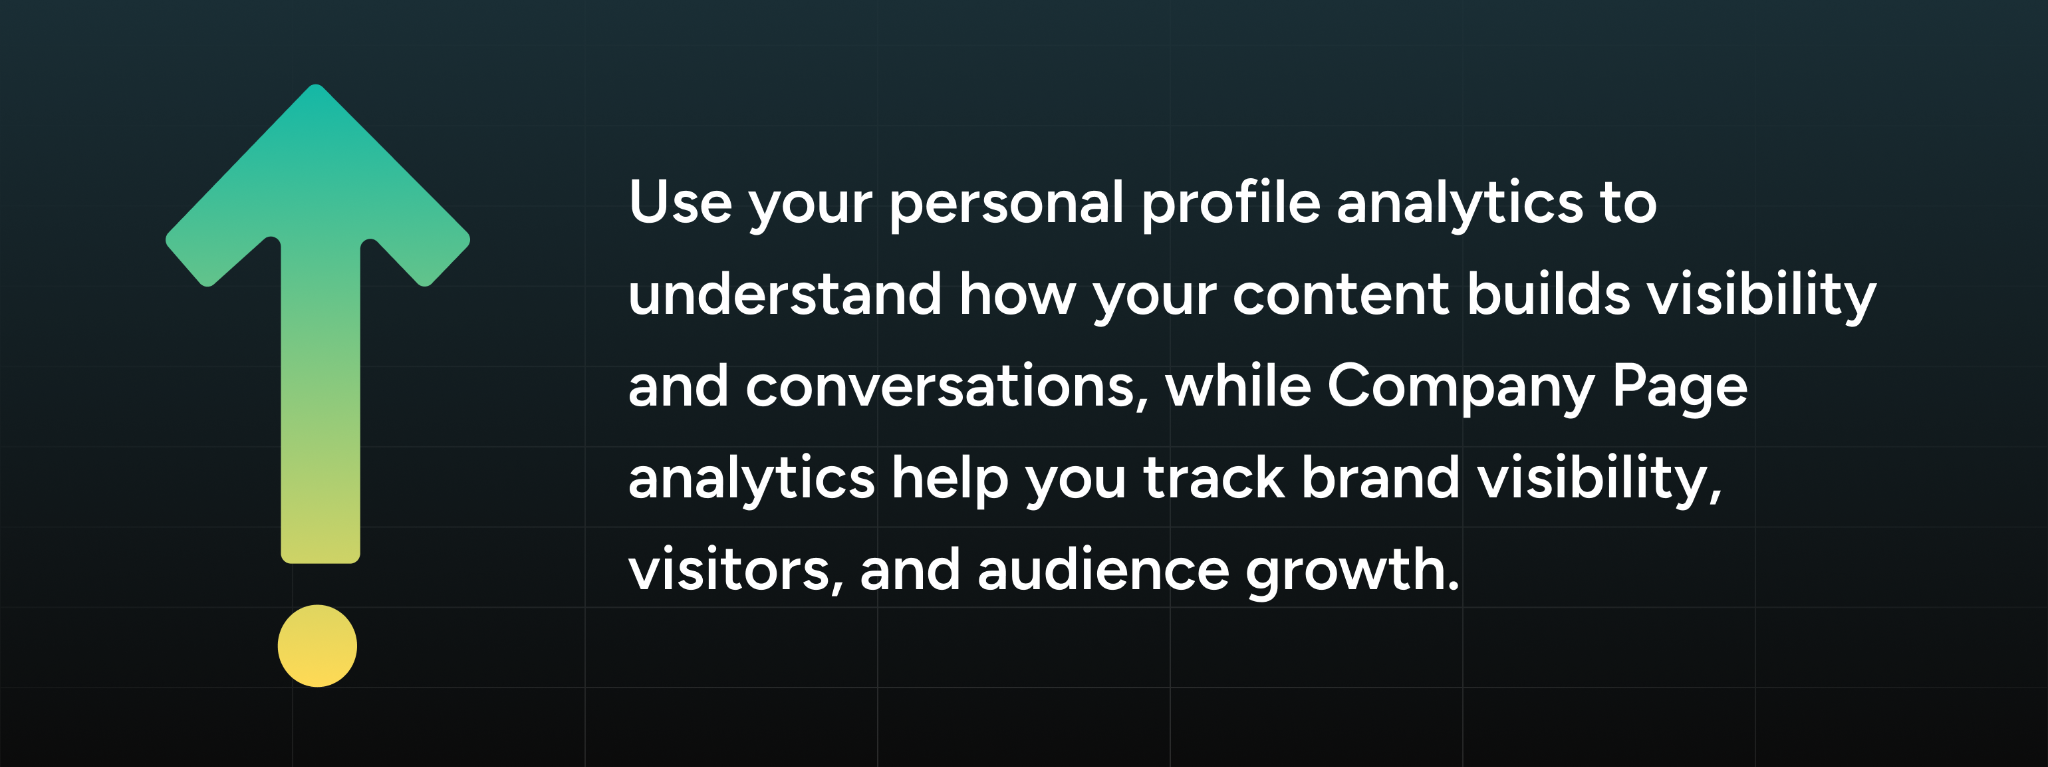
Treat the profile page and Company Page as separate tracks, with distinct goals and measures of success:
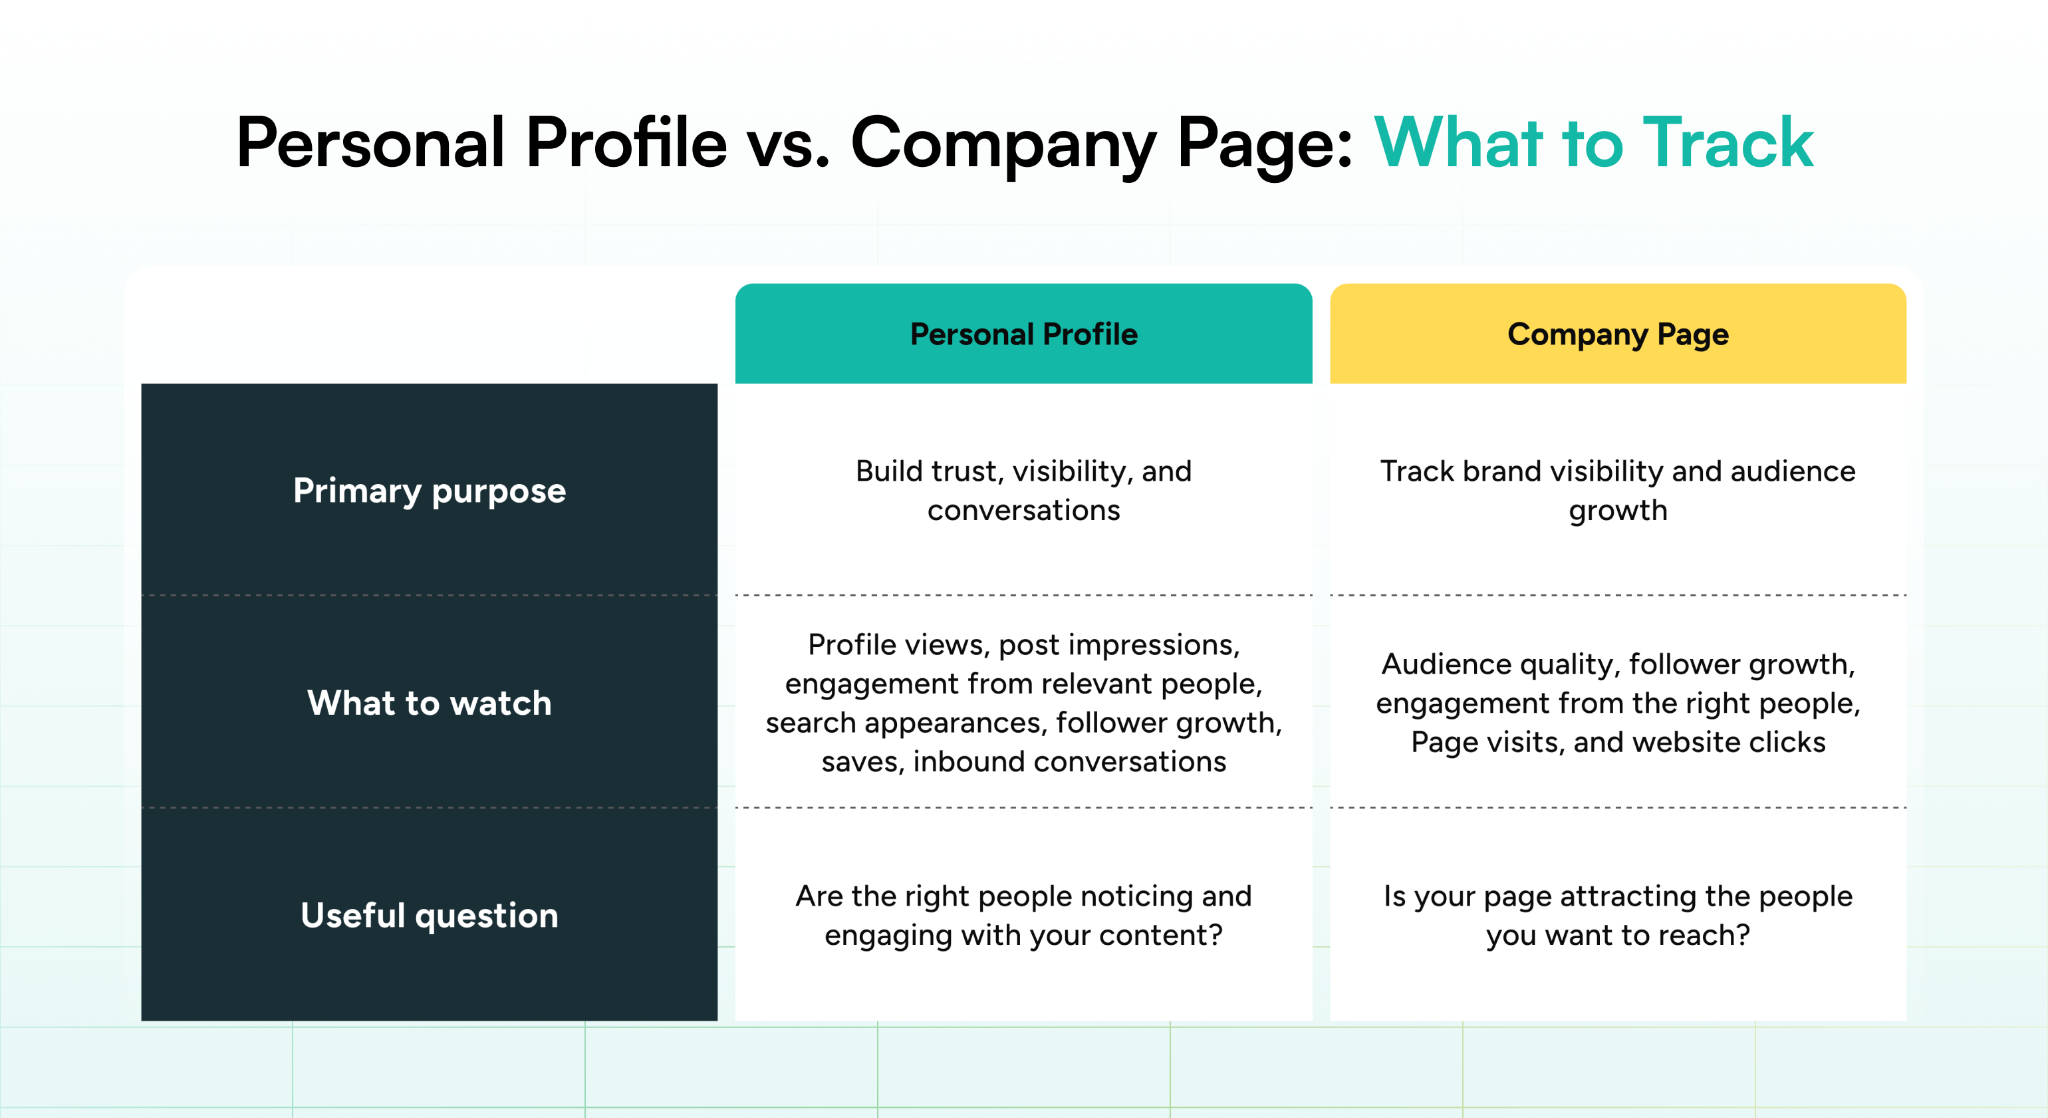
If your personal profile is generating more meaningful engagement and business conversations, put more of your time there rather than splitting your attention evenly just because two dashboards exist.
Where to Find Your LinkedIn Analytics
LinkedIn spreads analytics across a few different places, so it helps to know the map before you go hunting for a specific number.
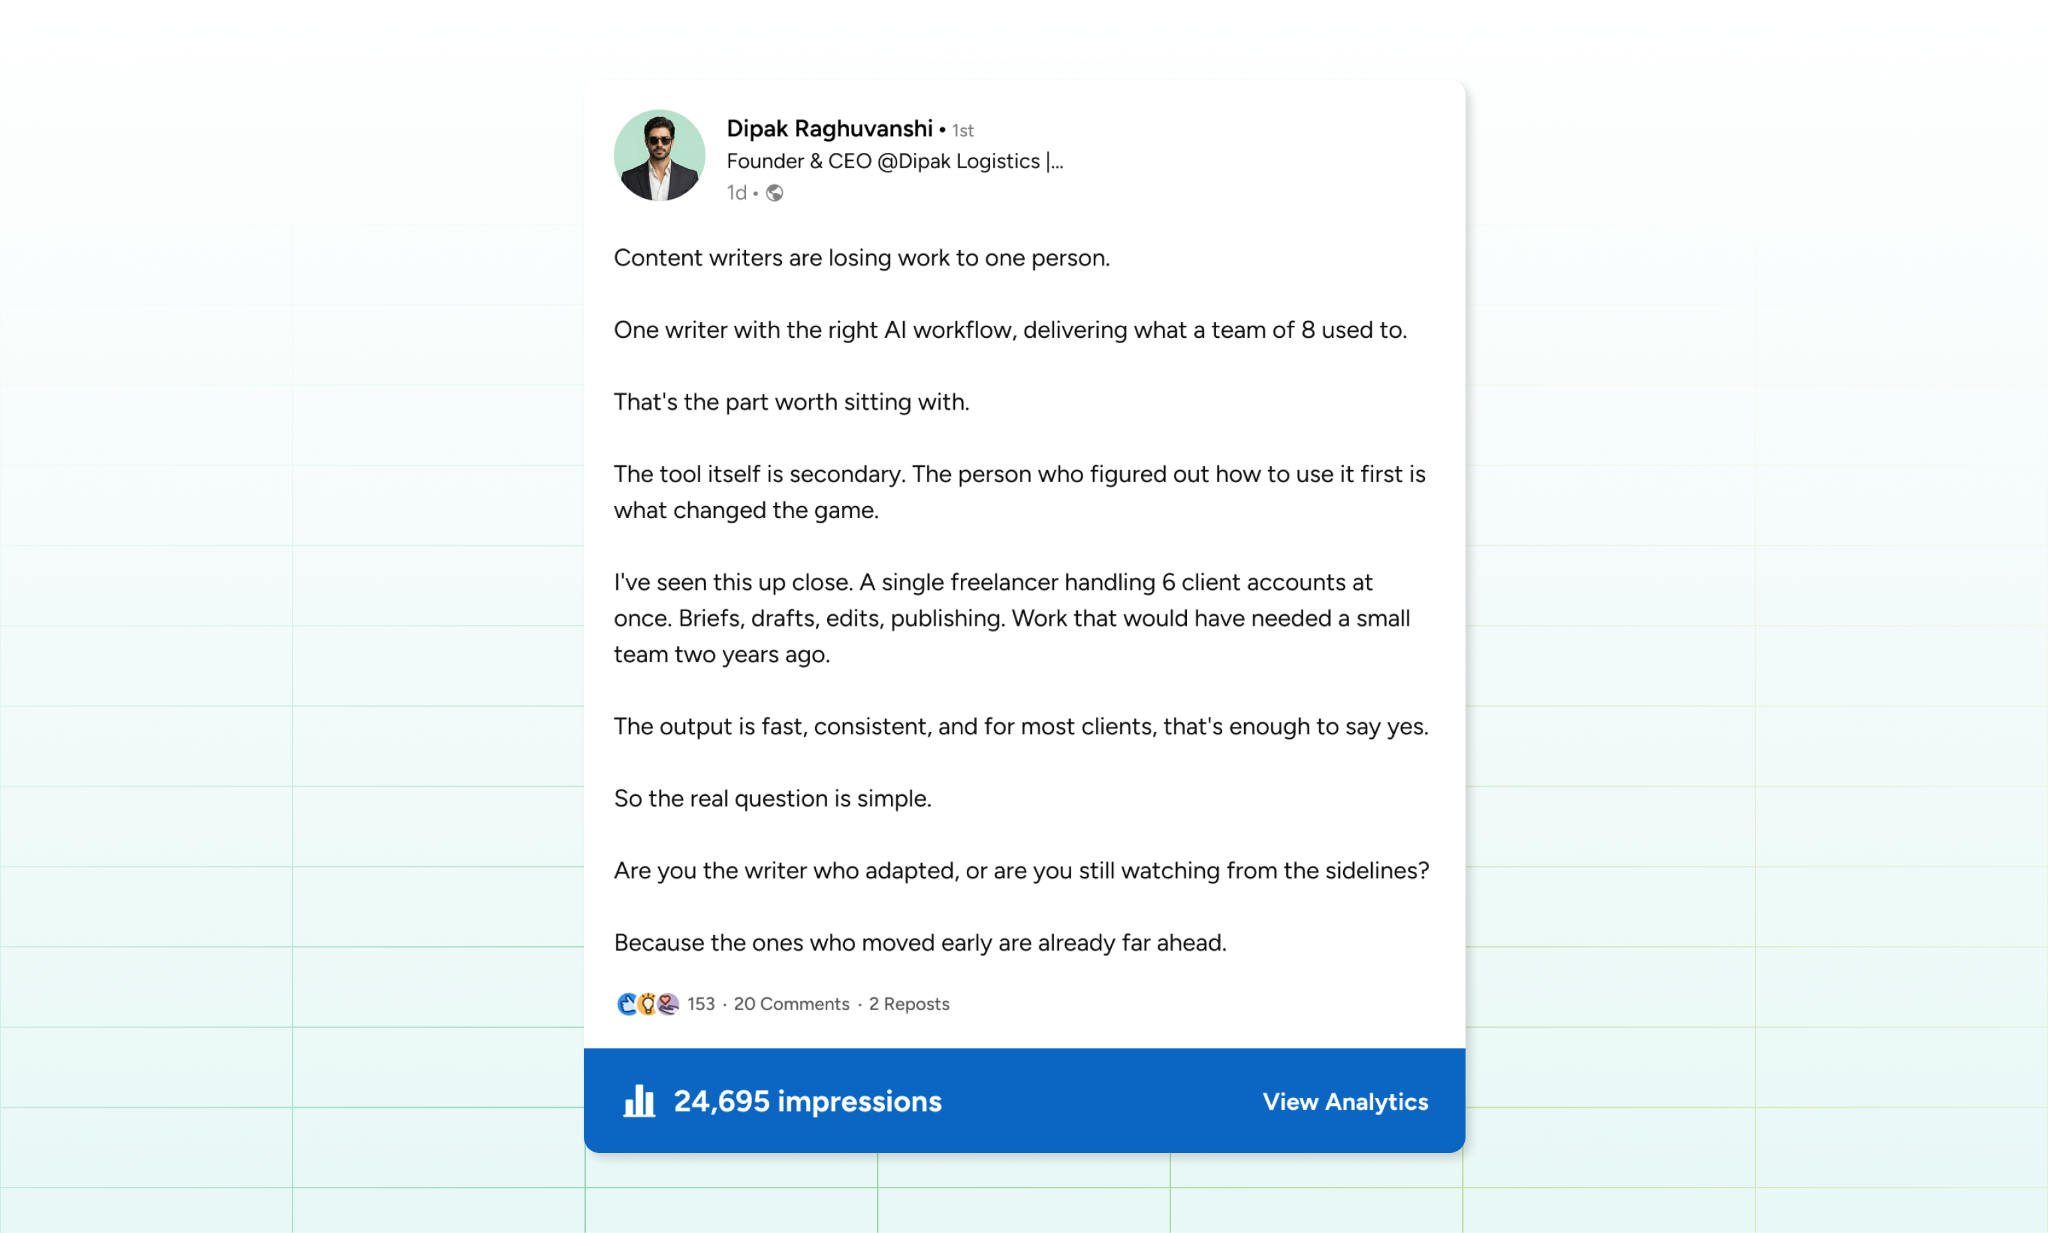
Post-level analytics sit under the impression count or the "View analytics" link at the bottom of a post you've published. This is where you'll find metrics for that individual post, including reach, engagement, audience, and profile activity.
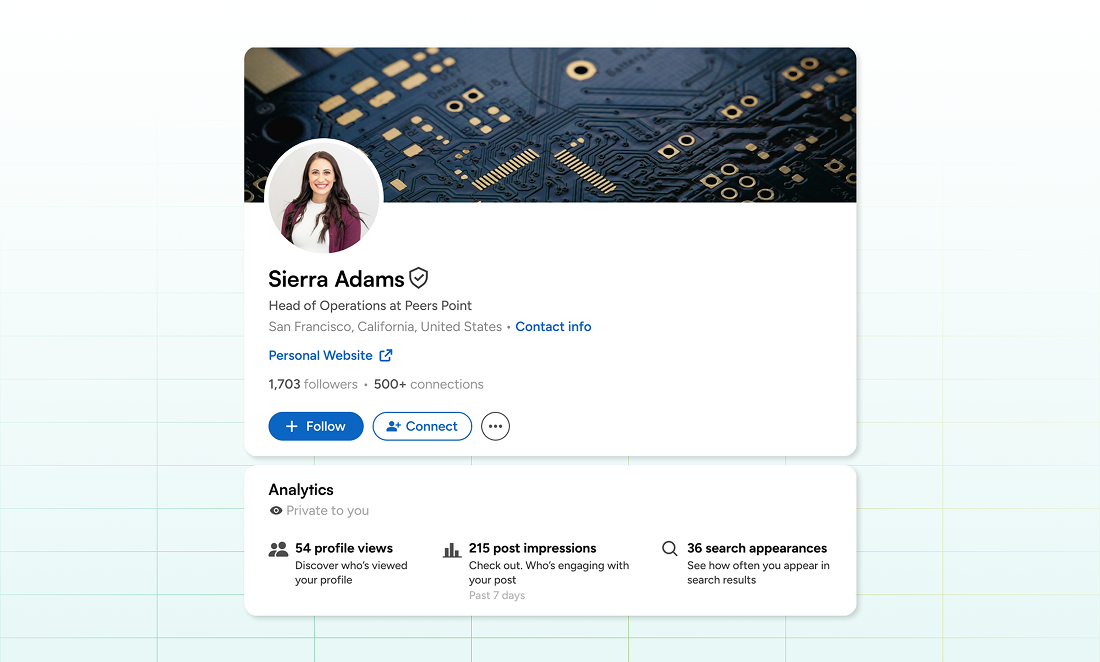
Your personal dashboard sits under the Analytics section of your profile. Click any of the three summary tiles (profile views, post impressions, or search appearances) to open the full view, where you can analyze content and audience data from the past 7, 14, 28, 90, or 365 days, or set a custom date range. Alternatively, you can click “Show all” to open the overall analytics overview.
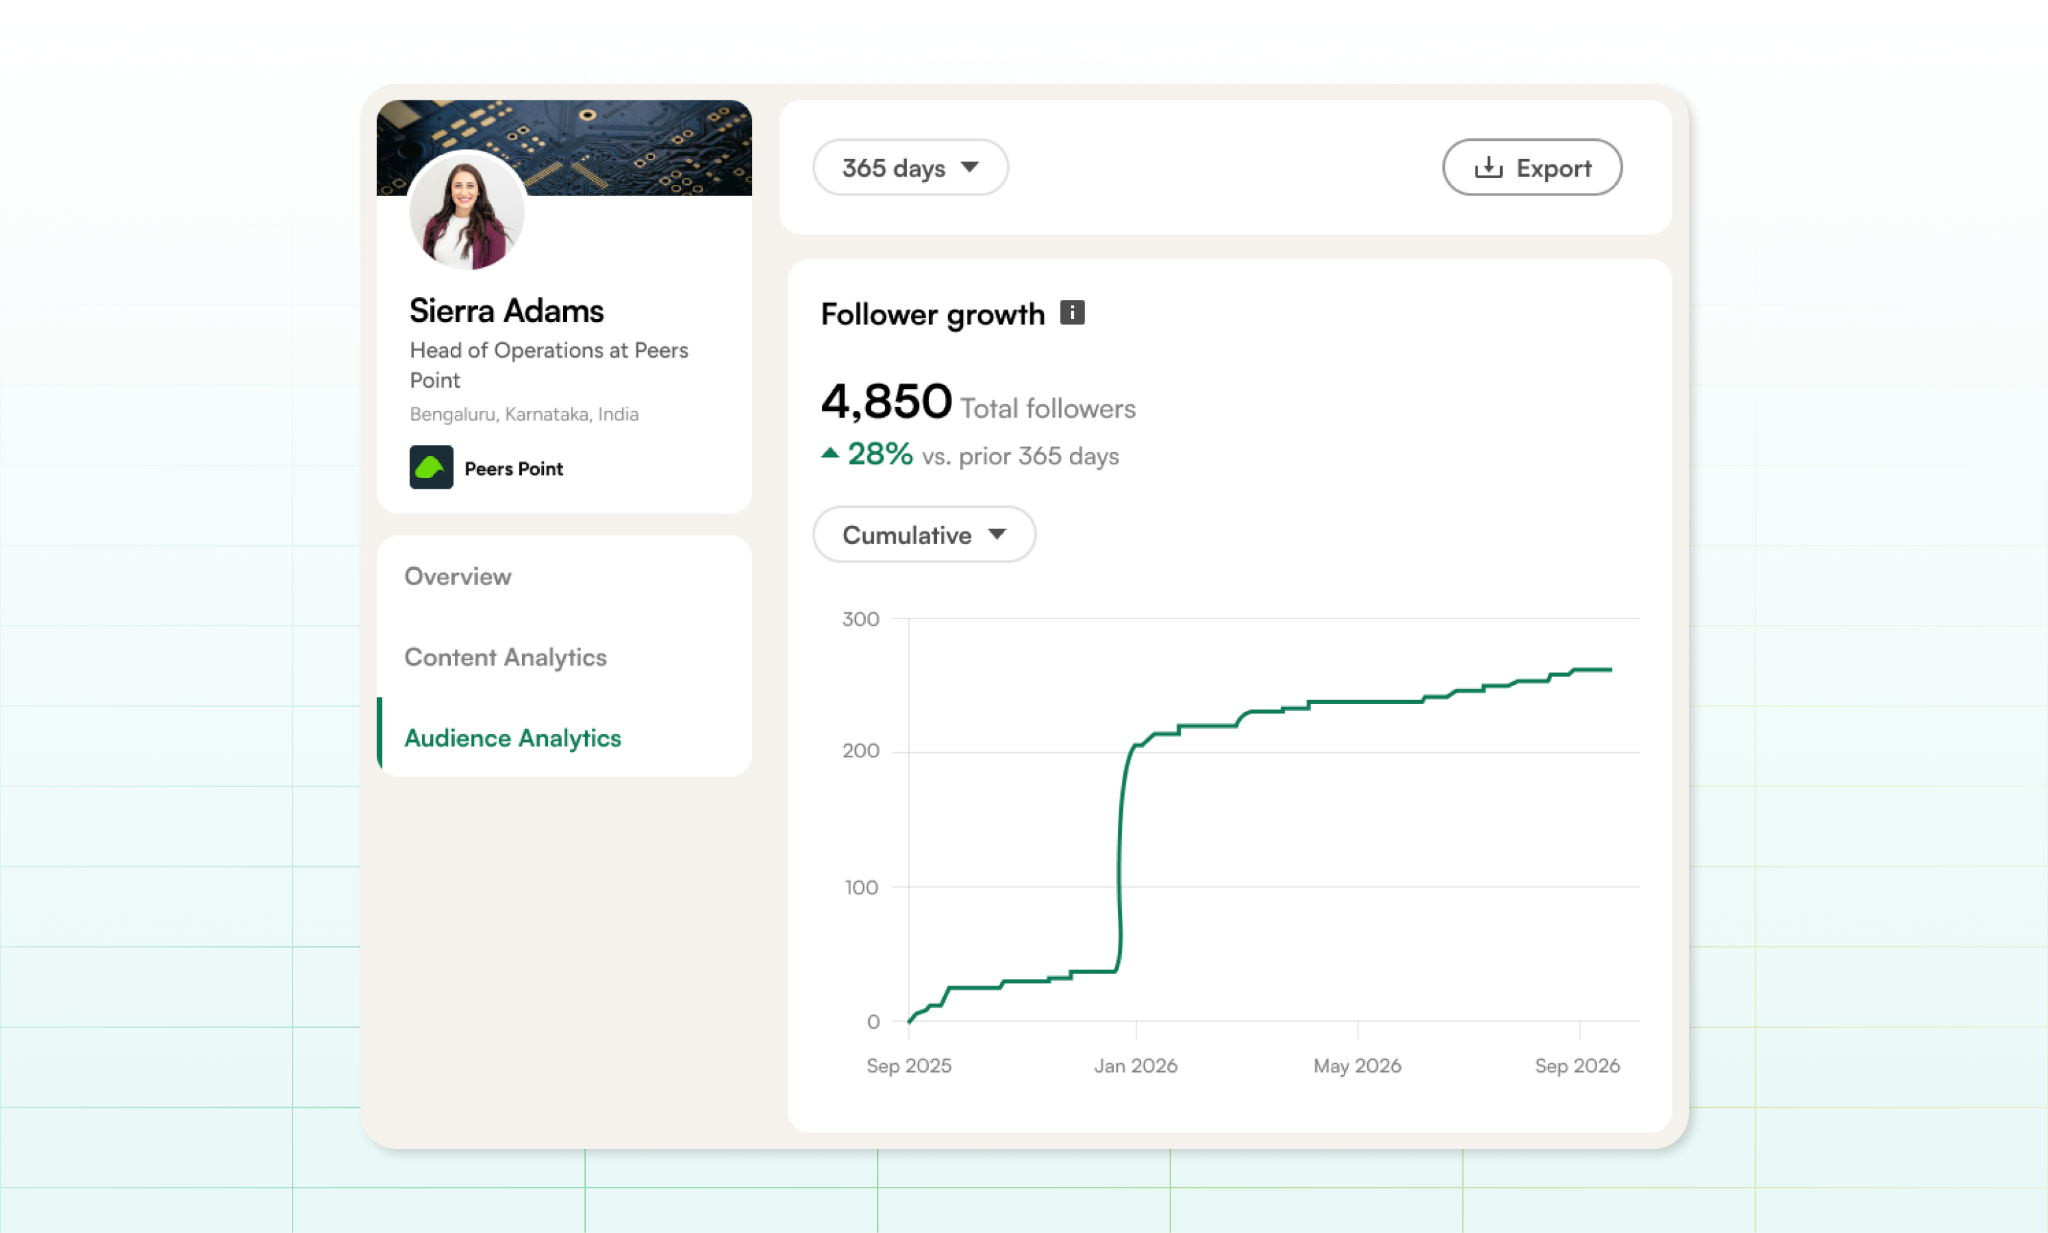
Follower and audience data are available under Audience analytics, where you can see follower growth trends and audience demographics.
Company Page analytics appear under Analytics in the Page admin view.
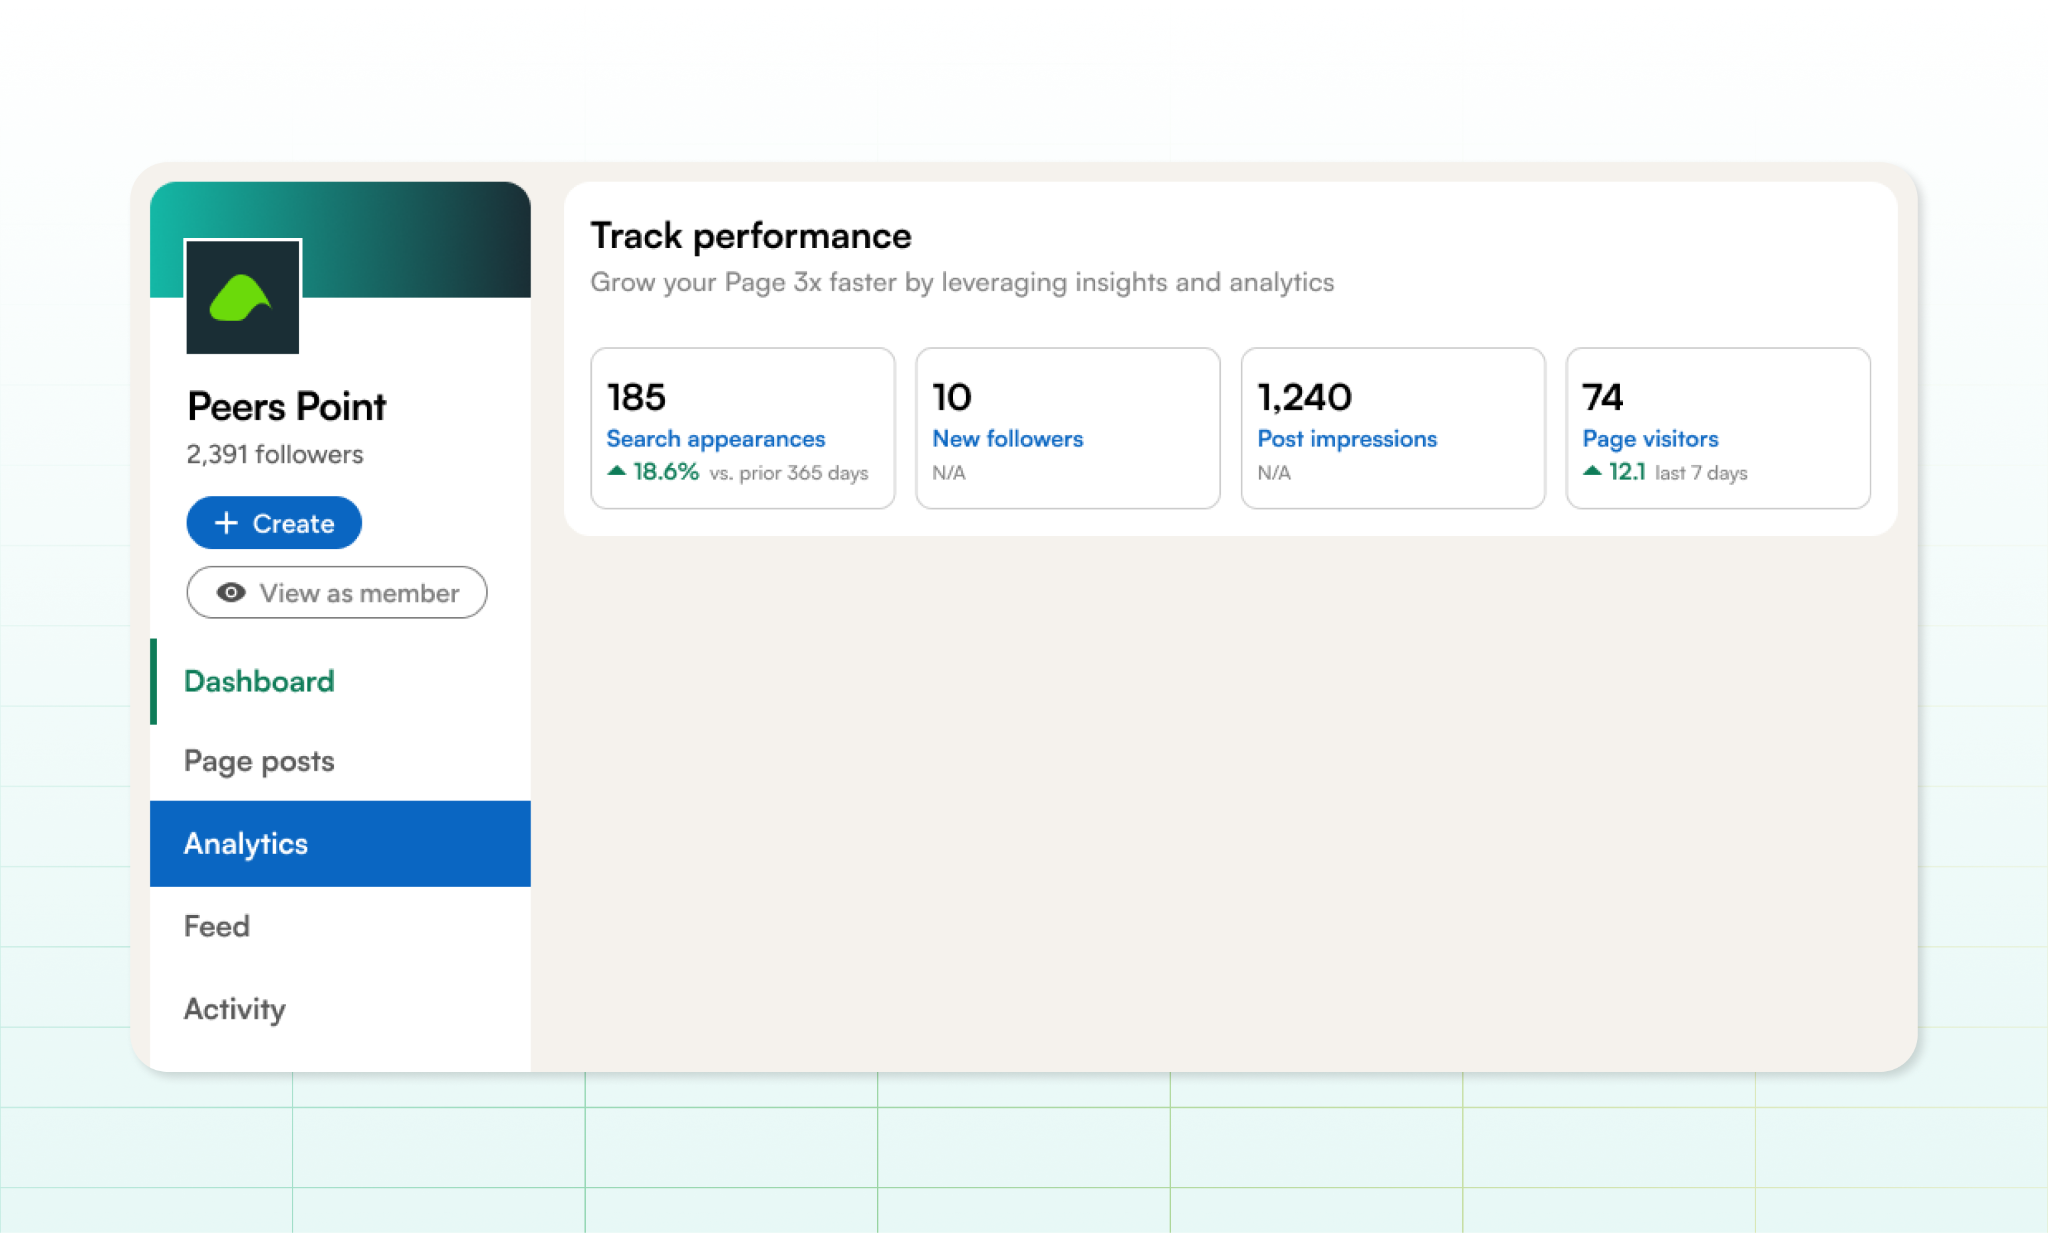
Depending on your Page and available features, you'll find sections such as Content, Visitors, Followers, Search Appearances, Leads, Newsletters, Competitors, and Employer Brand.
Campaign and ad data lives entirely inside Campaign Manager, separate from organic analytics, and includes cost and conversion metrics that organic posts skip.
An Overview of Post-Level Metrics
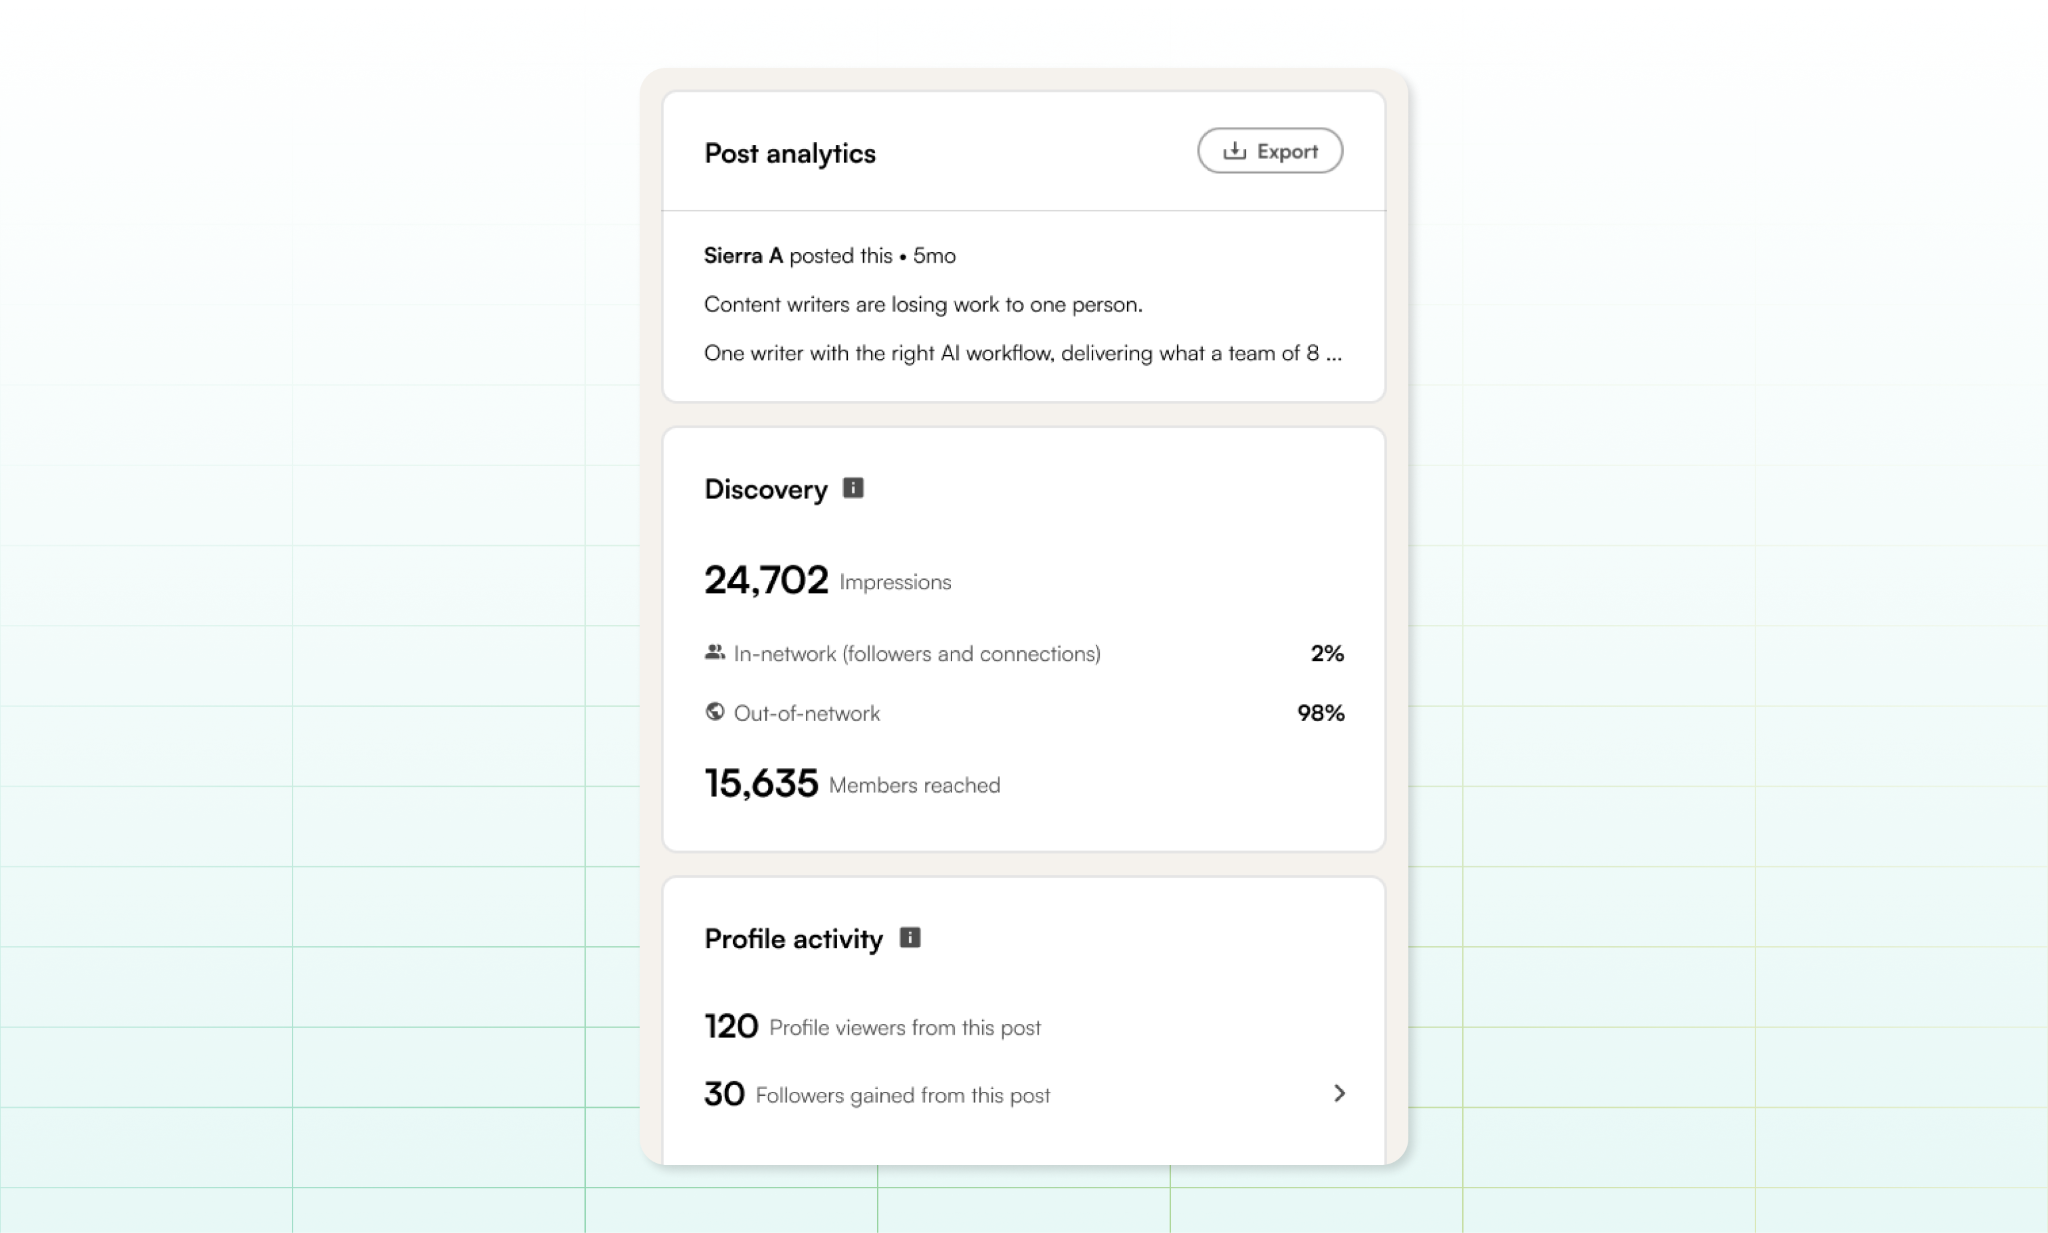
Here's what each number under an individual post actually tells you.
Impressions
Impressions count the total number of times your post appeared in someone's feed. LinkedIn logs an impression once at least half the post has been visible on screen for roughly 300 milliseconds, close to the time it takes to scroll past. A single person scrolling past twice generates two impressions, so this is a rough proxy for visibility rather than a confirmed read.
A high impression count tells you the post was distributed widely, but it does not tell you whether people stopped to read it, remembered it, or took any meaningful action afterwards.
Look at impressions across several posts rather than celebrating one spike. If certain topics or formats consistently travel further, that is a useful pattern. Then look at who that reach is coming from and what people do next.
Members Reached
Members reached counts the unique people who saw the post, stripping out repeat views. It's the cleaner "how far did this actually go" number. When impressions run noticeably higher than members reached, that might be because people came back to re-read the post, check the comments, or share it.
Engagement Rate
Engagement rate measures the share of people who took an action after seeing the post. LinkedIn counts reactions, comments, reposts, and clicks toward this total. The standard formula is:
Engagement Rate = (Reactions + Comments + Reposts + Saves + Shares) ÷ Impressions × 100
The important question is not simply whether the percentage went up. Look at what kind of engagement increased and who it came from.
Reactions Breakdown, Saves, Sends, Link Engagement, and Top Posts
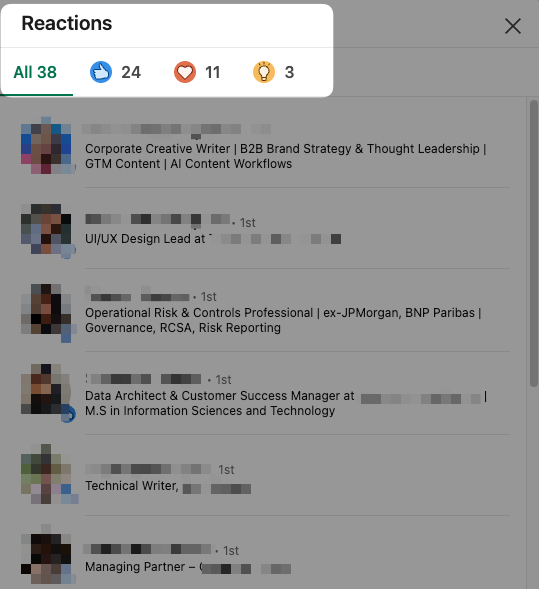
Reactions breakdown shows which of the six reaction types (Like, Celebrate, Support, Love, Insightful, Funny) a post pulled most. The mix can give you some context about how people responded to the content.
Link engagements show how many times people visited a link from your post. If you're using LinkedIn to drive people to an article, report, event, landing page, or another resource, this number tells you whether the post actually moved people beyond the feed.
A post can have modest reactions and comments while still sending a meaningful number of people to the next step, so don't judge its performance on visible engagement alone.
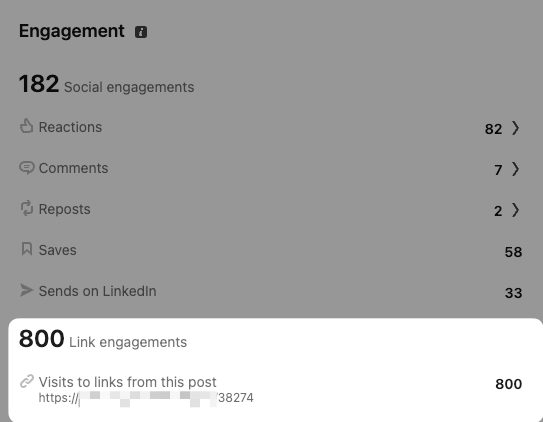
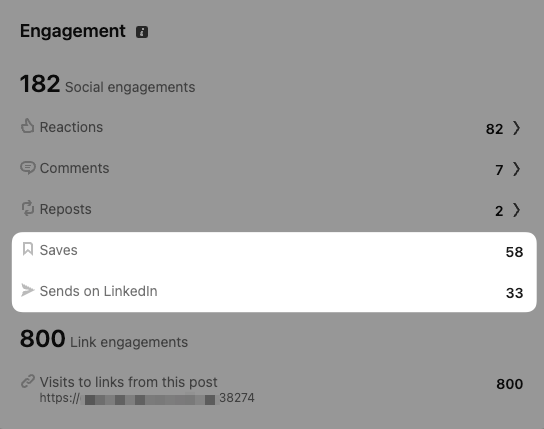
Saves show that people wanted to come back to a post, while sends show that they shared it privately with someone else. Both tell you something that reactions cannot: the content had enough value to be kept or passed along.
Look for topics that repeatedly earn saves and sends. Those patterns can show you which ideas have staying power with your audience and which ones naturally travel beyond the people who first see them.
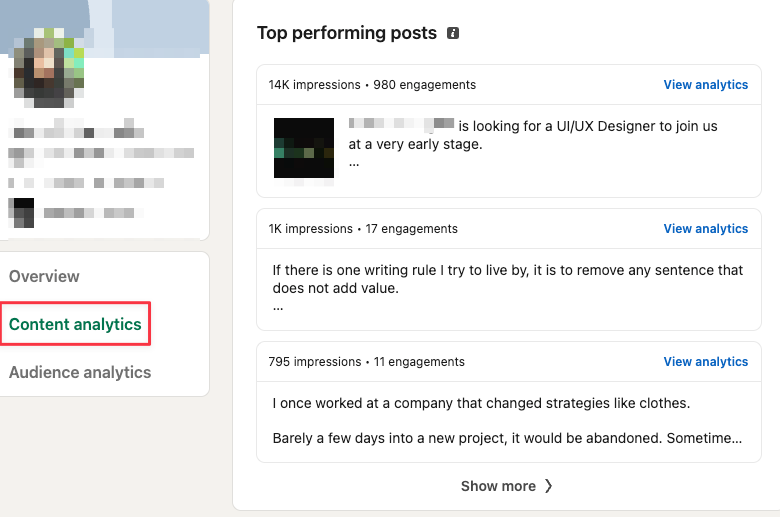
Inside Content analytics, LinkedIn lets you review your top-performing posts.
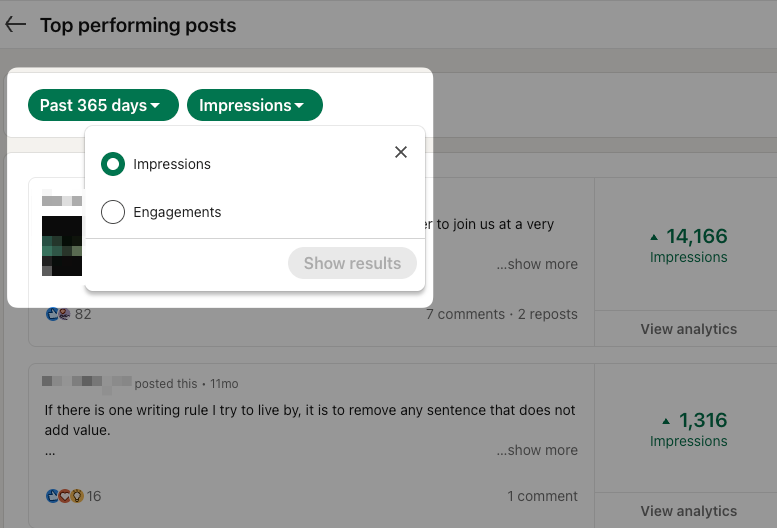
Review your last 10 to 20 posts (sorted by either Impressions or Engagements) and look for patterns across topics, formats, opening lines, audience response, and the actions each post generated. You may find that one topic consistently earns wider distribution while another generates fewer impressions but more saves, profile visits, or relevant conversations.
What a Good Engagement Rate Actually Looks Like
Mean vs Median
Averages can make LinkedIn engagement look higher than it is for a typical post because a small number of viral posts can pull the figure upwards. In a 2026 ContentIn study of more than 93,000 posts with impression data, the median engagement rate was 2.29%, compared with a 3.62% mean (average). The mean was 1.58 times the median, showing how much a small number of high-performing posts can skew the average.
Impressions vs Followers
When you’re checking your own LinkedIn analytics, an impression-based engagement rate gives you a clearer picture of how people responded to the posts they actually saw. Follower-based calculations can make the numbers harder to compare, particularly when a post reaches people beyond your follower base.
Personal Profiles vs Company Pages
Keep personal profiles and Company Pages separate when comparing performance. Their audiences, distribution, and role on LinkedIn are different, so a Company Page benchmark is not a particularly useful target for an executive's personal content.
More importantly, establish your own baseline. Pull your recent posts from LinkedIn analytics, check the engagement rate for each, and consider the median. Then compare future performance against that number rather than allowing one unusually successful post to become the standard every other post has to meet.
What's Actually Driving Distribution Now
Anyone still optimizing purely for likes is missing the bigger picture. LinkedIn's feed has become more focused on understanding what content is relevant to each person.
In March 2026, LinkedIn Engineering published a detailed account of its feed rebuild. It described a system that uses large language models to identify relevant posts, alongside a transformer-based ranking model called the Generative Recommender.
The update also fits with LinkedIn's wider research into AI-powered recommendations, including work around its 360Brew model. You don't need to understand the technical architecture to take something useful from it. LinkedIn is getting better at understanding what a post is about, who might find it relevant, and which content is worth surfacing to each member.
So, don't read a high reaction count as the final verdict on a post. Signals such as dwell time, saves, and meaningful comments are increasingly serving as useful indicators of content quality.
A few practical takeaways follow from this shift:
- A post with 40 likes and three detailed, specific comments from the right people carries more weight than a post with 400 likes from people who scrolled past. Reaction count on its own tells a partial story now.
- Carousels and native document posts are shown to consistently outperform other formats. However, don’t assume that one format would win over everything else for your audience. Compare formats across several posts and look at the outcomes you actually care about.
- Links inside the post body tend to cost reach, with one analysis reporting posts can lose roughly 60% of their reach when a link sits in the body instead of the first comment.
Profile and Audience Metrics
Individual post metrics show you what happened with a piece of content. These three areas help you understand what is happening around your profile and the audience you're building.
Profile Views
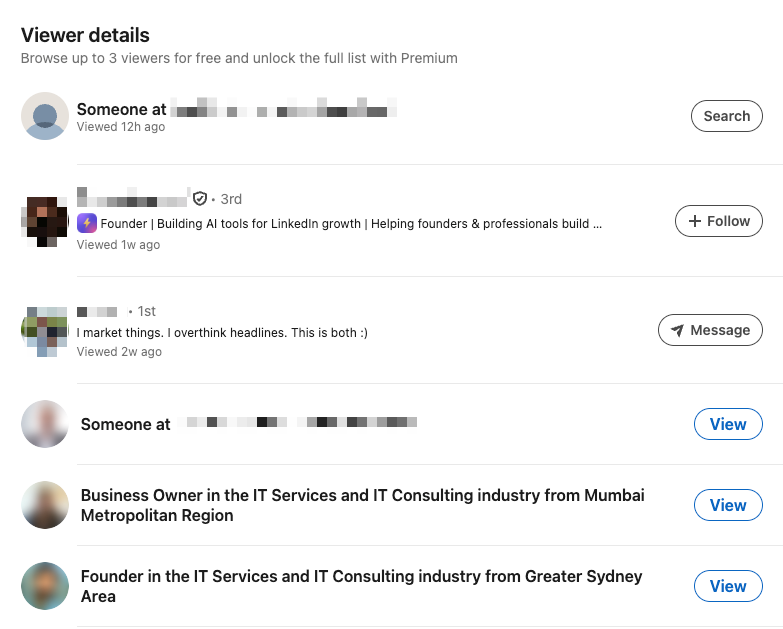
Profile views show how many times your profile was visited within a given period. Free accounts see the three most recent viewers from the past 90 days, while Premium accounts can see the full list for up to 365 days and filter viewers by criteria such as date range, company, industry, and viewer type.
Watch for changes alongside your content activity. If profile views jump after a strong post, a comment that attracted attention, or a mention by another creator, dig into the viewer list and see who came looking. A surge in views is much more important when those visitors include prospective clients, investors, candidates, partners, or others you want your content to reach.
Search Appearances
Search appearances show how often your profile appeared in LinkedIn search results and provide information about the people finding you, including their job titles and companies.
If appearances are consistently low, review your headline, About section, experience, and skills. The language across your profile should reflect the expertise, topics, and roles you want people to associate with you and search for.
Follower Analytics and Audience Demographics
Follower analytics break down your audience by job title, location, industry, seniority, company size, and company, with date ranges from the past 7 days up to a full year.
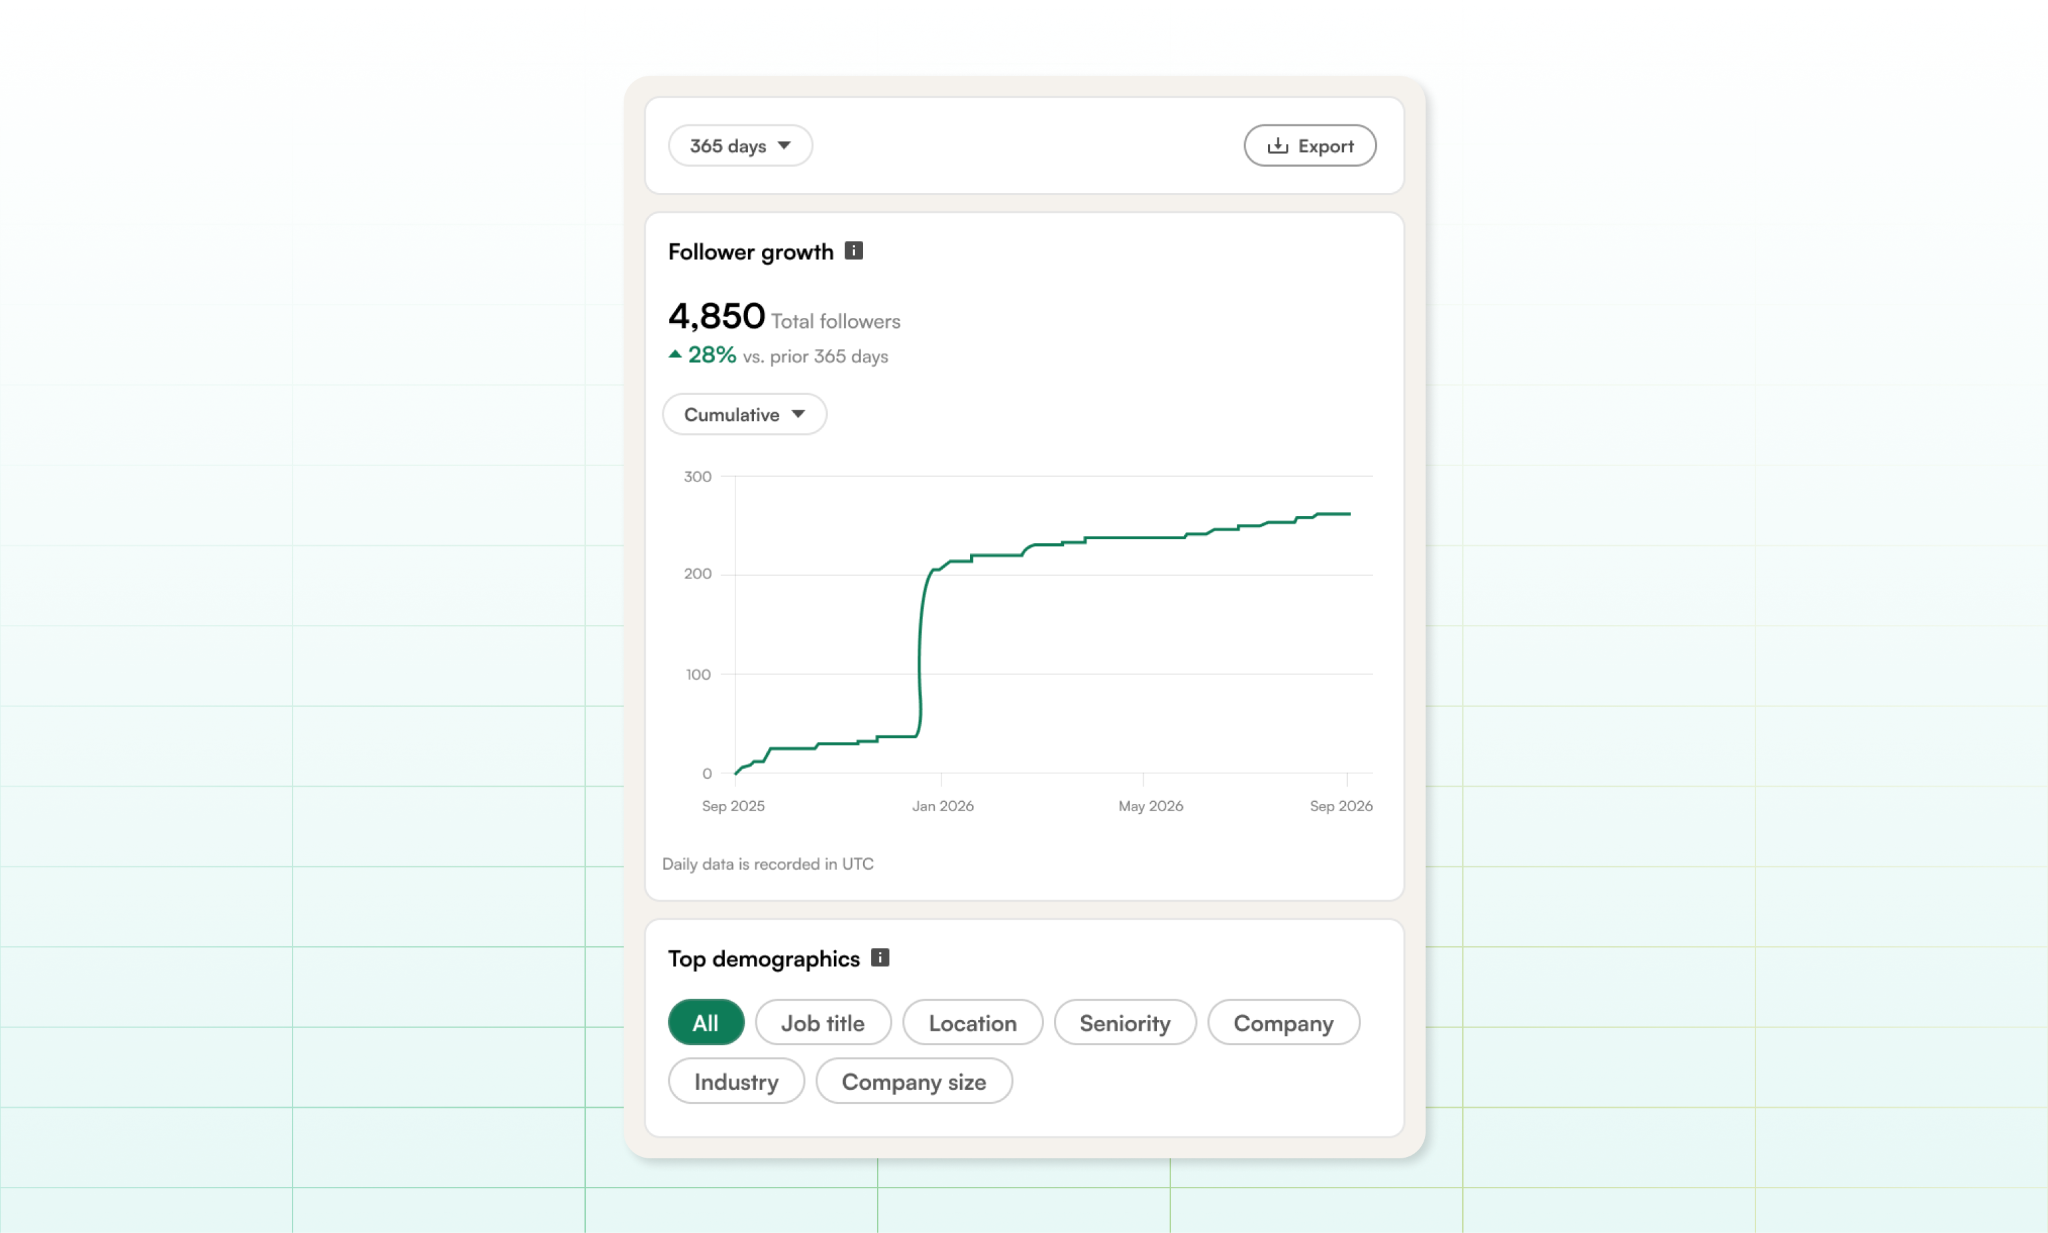
Don't stop at whether your follower count is rising. Look at who is joining the audience. If you're a B2B founder trying to reach enterprise decision-makers, for example, growth among students or entry-level professionals tells you something very different from growth among directors and senior executives.
Follower growth becomes much more meaningful when the audience you're building resembles the audience you actually want to influence.
LinkedIn Company Page Metrics
Company Page analytics answer a different set of questions from your personal profile. They can show you who is visiting your Page, how your follower base is changing, and whether you're building visibility with the audience your company wants to reach.
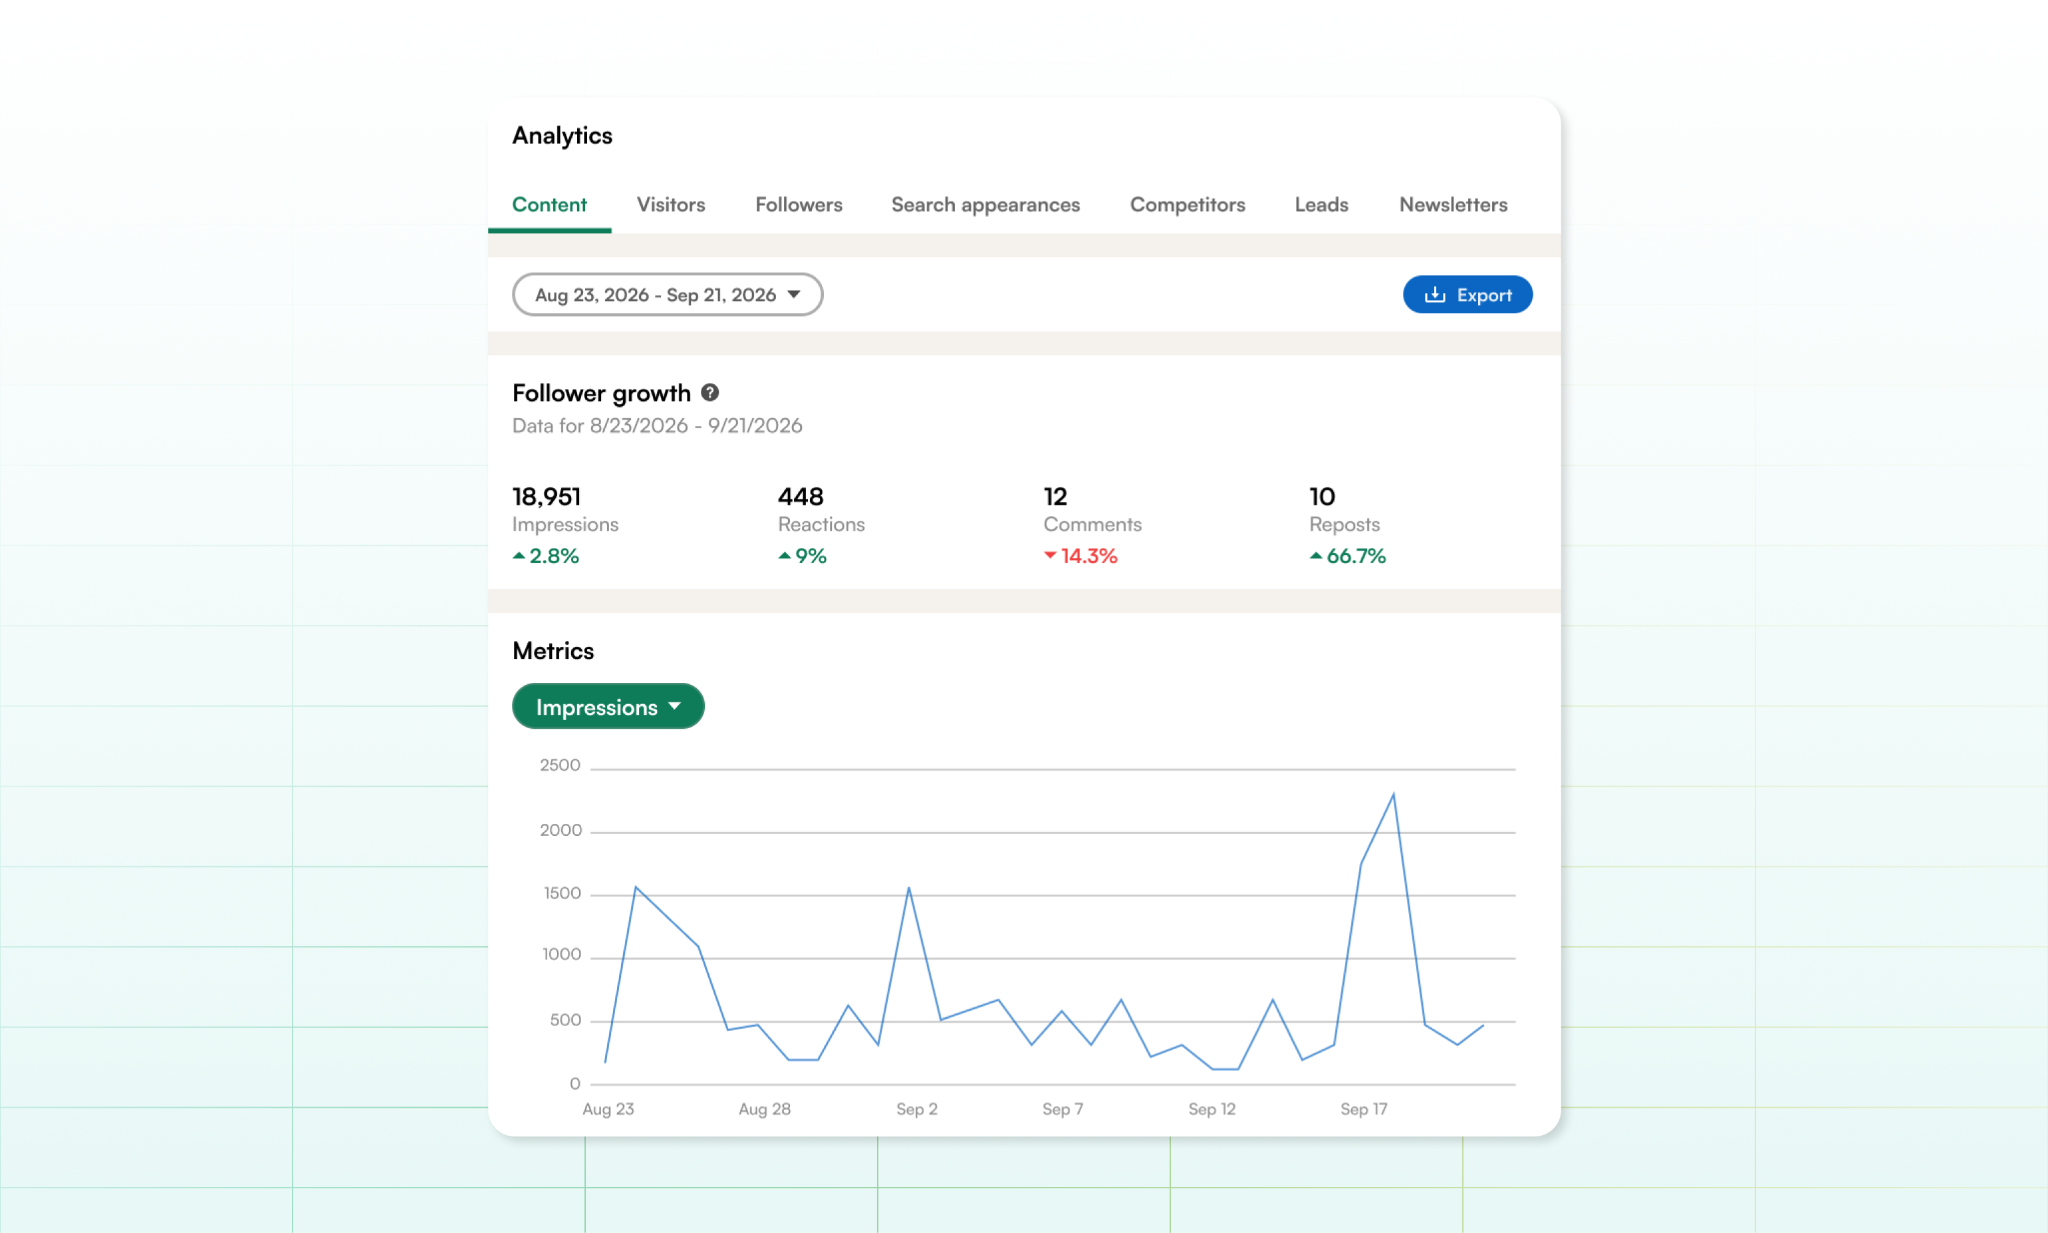
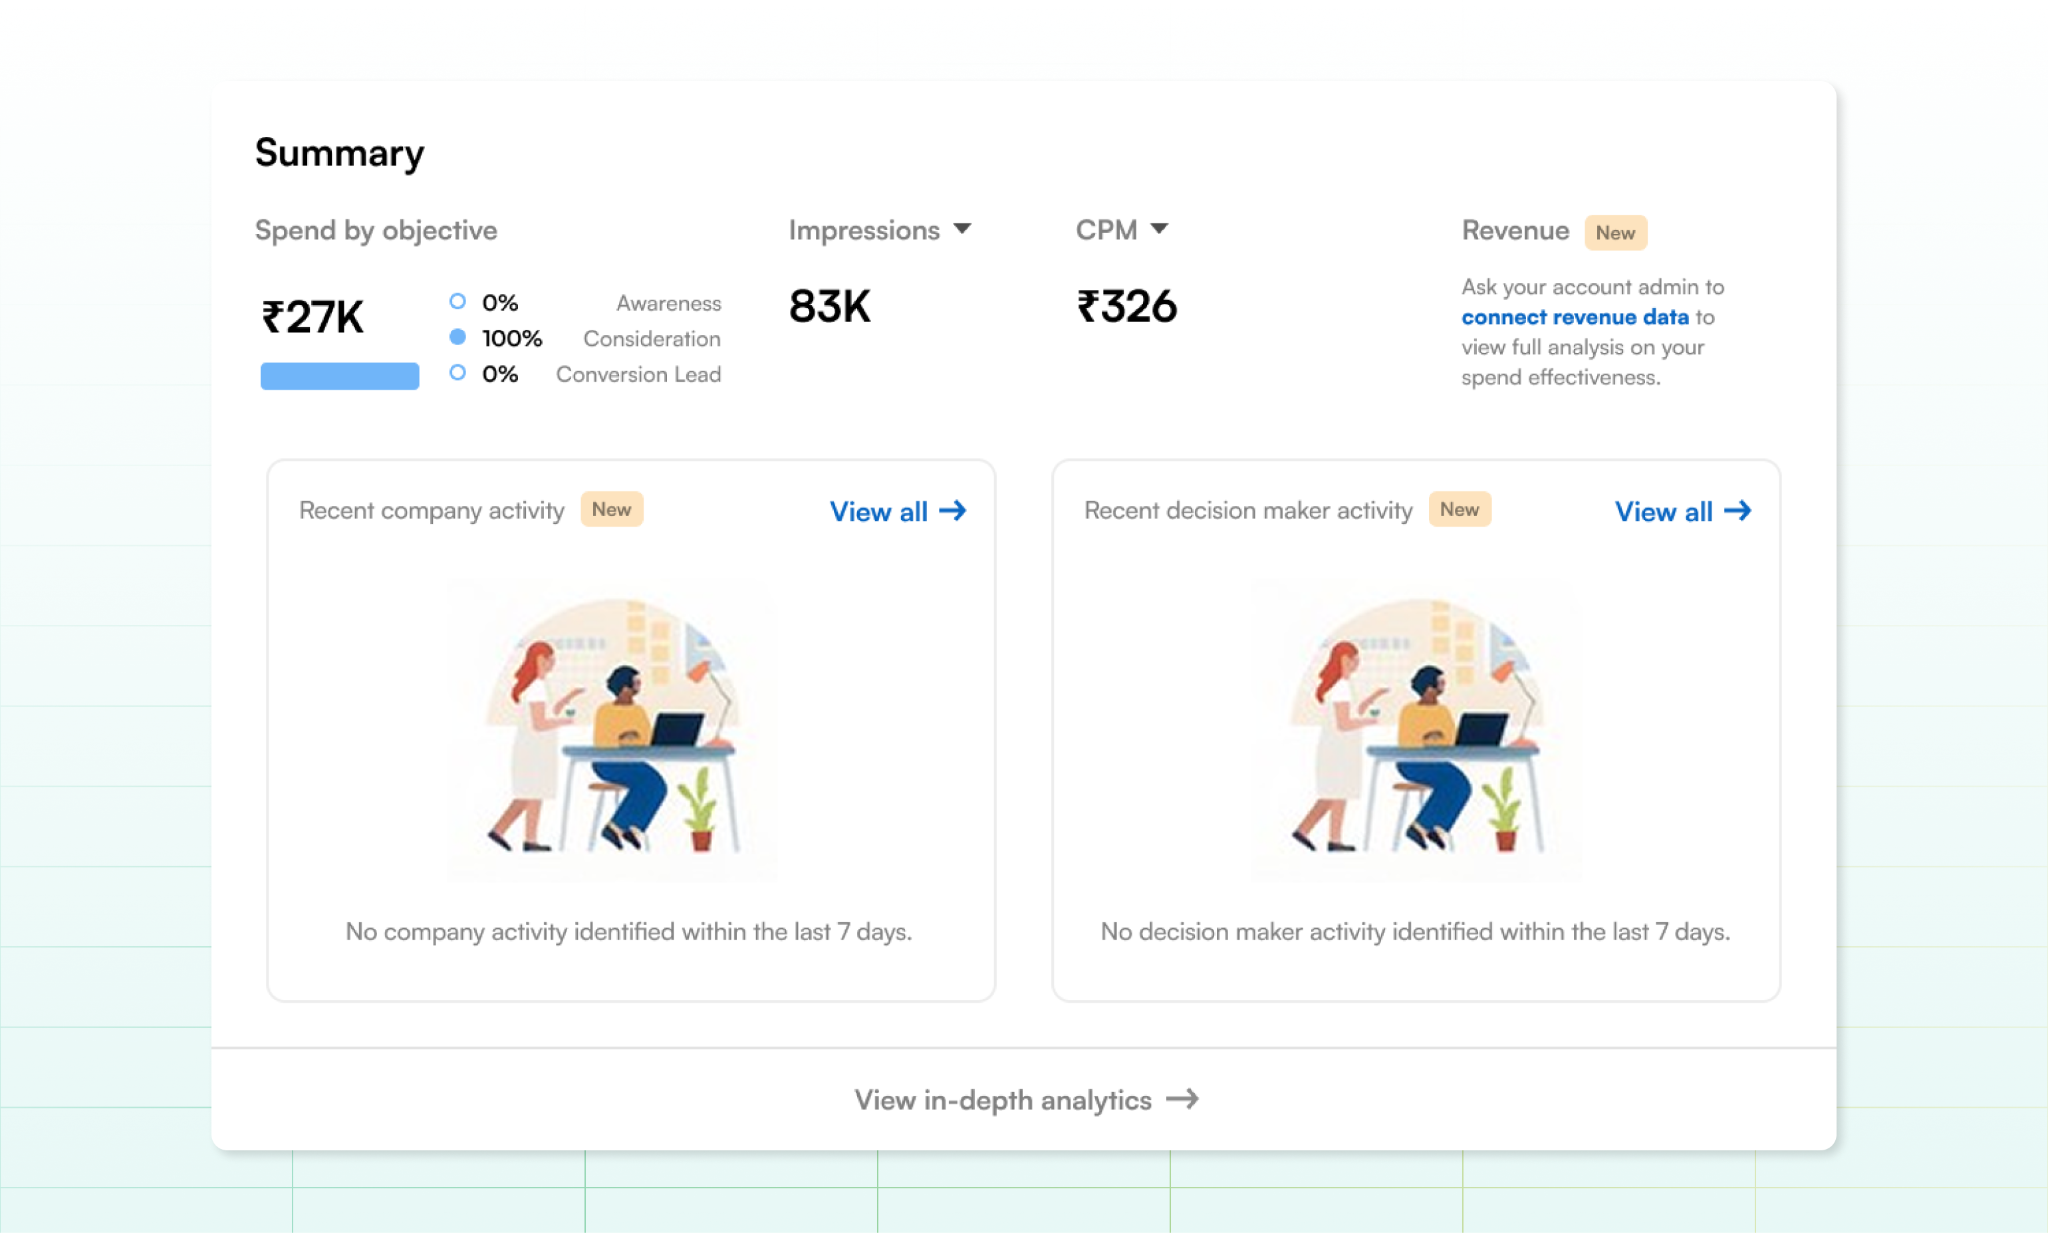
For instance, the Content tab, shown above, gives you a quick view of impressions, reactions, comments, and reposts over your selected period. But you don't have to stop there. The Visitors and Followers tabs can tell you much more about who that activity is coming from and whether your audience is moving in the right direction.
Here are the main Company Page metrics and what each one tells you:
- Page Views: How many times your Page was viewed, including repeat visits.
- Unique Visitors: How many individual members visited your Page.
- Visitor Demographics: Who is visiting, including their location, industry, job function, seniority, and company size.
- Total Followers: The current size of your Page audience.
- Organic Followers: How many followers you gained without paid promotion.
- Sponsored Followers: How many followers came through paid campaigns.
- Follower Trends: How your audience is growing or declining over time, including organic and sponsored growth.
- Video Views: How often people viewed your video content.
- Reposts: How often people reposted your content to their own networks.
- Engagements: The interactions your content generated, including reactions, comments, reposts, and clicks.
Match Your Metrics to Your Goal
Every metric competes for your attention, so let your business goal decide which ones you turn to.
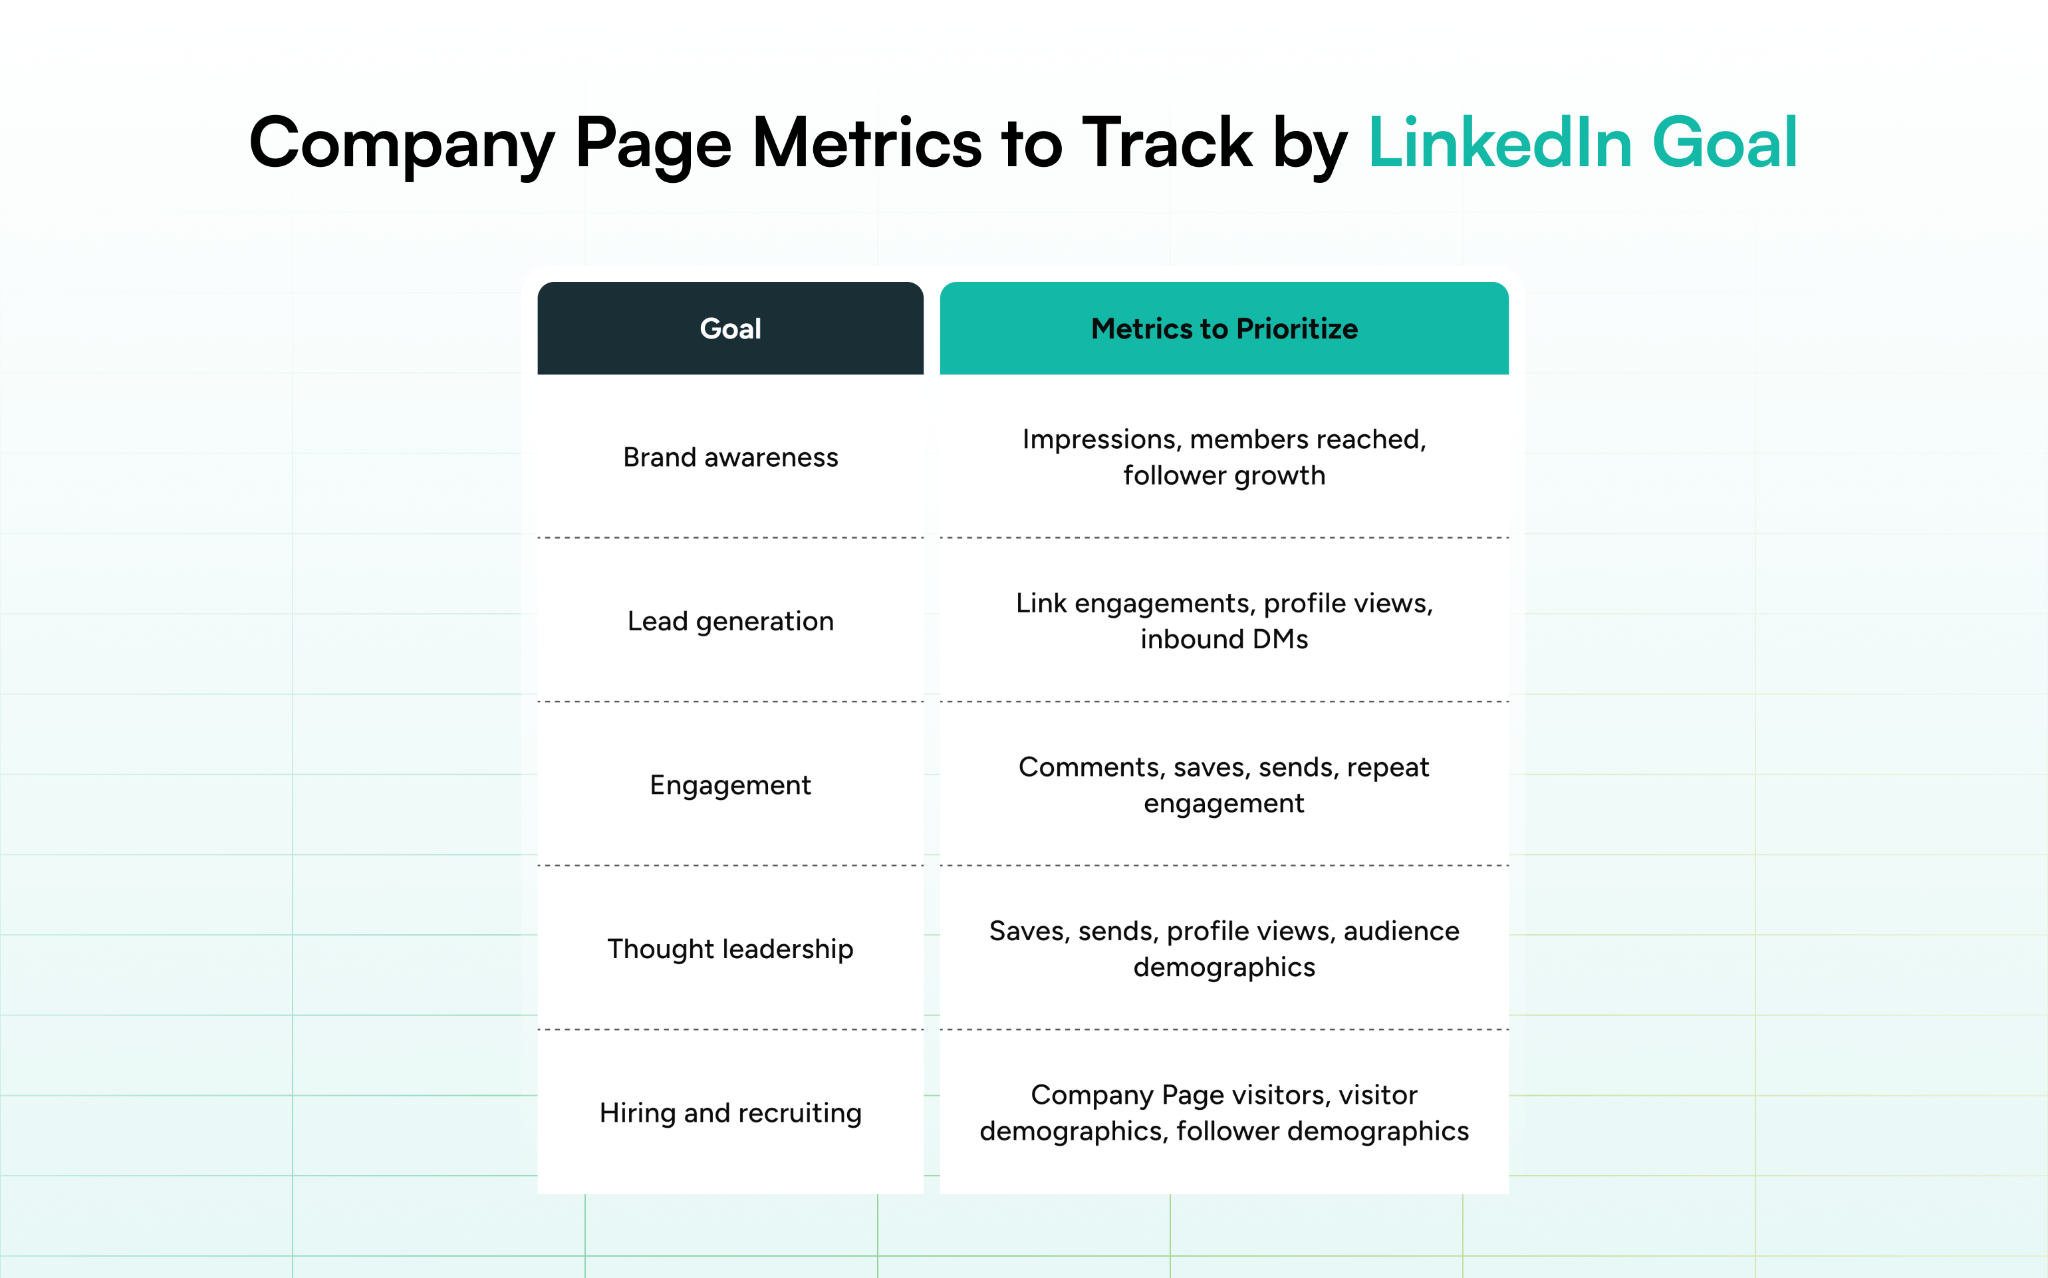
Pick the business outcome you most want from LinkedIn this quarter, and track the metrics tied to that outcome closely. Everything else stays useful context, secondary to the number that is actually helping you make progress toward that goal.
Check Whether the Right People Are Engaging
An engagement rate sitting inside your usual range leaves out an important detail: who actually engaged. You can get a reasonable read on that in a few minutes.
- Pull the list of people who engaged with your last three posts.
- Check each person's title, seniority, and company against the audience you're actually trying to reach.
- Look at the mix. Are the people you want to reach showing up consistently, occasionally, or hardly at all?
A modest engagement rate from the right audience beats a strong rate from the wrong one every time. Run this check regularly, especially when your content topics change. You may find that the numbers stay steady while the audience behind them gradually shifts.
How Long LinkedIn Actually Keeps Your Data
LinkedIn does not keep every type of analytics available for the same length of time. Your combined post analytics let you select a period from the past 7 days up to 365 days, but some underlying post-level data remains available for much longer.
For most content types, LinkedIn keeps discovery and social engagement counts for 1,000 days, while members reached data is available for 400 days and demographic breakdowns for 180 days. Video performance and viewer demographics are available for 180 days, while article performance, article viewer demographics, and newsletter-specific analytics remain available for two years.
If you want to compare performance over several years, LinkedIn lets you export combined post analytics and audience analytics as an .xlsx file, so a quarterly or annual export gives you a record you can return to later.
Some third-party LinkedIn analytics tools can also help maintain longer histories and make trend analysis easier, but check what data the tool stores, what access you're granting it, and whether its metrics are calculated the same way as LinkedIn's. For most executives and smaller teams, periodic exports are the simpler way to build a long-term record without adding another platform.
Connect LinkedIn Activity to Business Outcomes
LinkedIn analytics can show you what happened on the platform, but they cannot tell you that someone who read your post in January became a client in March. You need to connect those dots yourself.
You don't need to build a complicated attribution model. Keeping a simple log with the following data can work:
- Signal: The post, comment, profile visit, or other LinkedIn activity that first put the person on your radar.
- Engagement: Who engaged, their role and company, and whether they fit your target audience.
- Conversation: The DM, introduction, meeting, or call that followed, with the date.
- Outcome: What eventually happened, whether that was an opportunity, hire, partnership, win, loss, or another relevant result.
A few well-qualified entries each month are enough to make the log useful. After some months, the log can start showing which topics and interactions repeatedly lead to conversations with the people you want to reach, and which ones generate engagement without going any further.
How Often to Check Your Numbers
Daily checks tend to produce shaky calls, since a post that looks flat on day one can pick up momentum over the next few days as comments accumulate and LinkedIn widens distribution in response. Waiting until the end of the month swings too far the other way, since the individual who engaged in detail may already have moved on by then.
A weekly review is a good middle ground. Time it around your posting schedule and look at three primary factors:
- Did the people engaging with your posts match your target audience?
- Which posts generated the strongest response? Look beyond reaction counts and check comments, saves, and other available engagement data.
- What can you change in your next post based on what you saw?
If you post on Tuesday and Thursday, for example, a Friday review gives you a chance to look at the latest results while they're still fresh. Then, once a month, take a broader look at follower growth, search appearances, and audience demographics.
Habits That Skew Your LinkedIn Analytics Reading
Even good data can point you in the wrong direction if you read it without context. Here are some habits that can make your numbers look more or less meaningful than they really are:
- Comparing your engagement rate with an external benchmark only works if both are calculated the same way. A follower-based rate and an impression-based rate can produce very different percentages for the same post.
- Judging a post on its first day can give you an incomplete picture. Posts can continue reaching people and attracting engagement over the following days, so give them time before drawing conclusions.
- Looking mainly at reactions can hide some of the more interesting signals. Comments, saves, sends, profile activity, and who is behind those actions can tell you much more about how a post landed.
- Expecting personal profiles and Company Pages to produce similar results ignores the different jobs they do. Measure each against the goals you've set for it rather than expecting the same numbers from both.
Conclusion
LinkedIn analytics can prove useful when they help you make better business decisions, rather than simply report bigger numbers. Impressions, reactions, and follower growth all have their place, but they do much more when you know who is behind them and whether that attention is leading anywhere.
Over time, recurring patterns gain precedence over any single post. Which topics consistently reach the people you want to reach? What gets them to save, respond, visit your profile, or start a conversation? And which numbers look impressive but don’t actually lead to anything more than a token reaction?
If you're putting time into LinkedIn but aren't sure whether your content, profile, and overall strategy are reaching the right people or contributing to your business goals, schedule a call with GrowedIn. We can look at where you are now and help you build a LinkedIn strategy around the outcomes you actually want.

Frequently Asked Questions
What is a good LinkedIn engagement rate?
There isn’t any single engagement rate that counts as good for every LinkedIn account. Benchmarks vary depending on how the rate is calculated, whether you are looking at a personal profile or Company Page, and the audience you reach. Your own median engagement rate is often a more useful baseline for comparison.
What's the difference between impressions and members reached?
Impressions count the times your post was displayed, including repeat impressions from the same person. Members reached counts the unique members who saw your post. For example, 3,000 impressions and 1,500 members reached means the post generated 3,000 impressions among 1,500 unique members. The two figures are useful together because they show both total exposure and unique reach.
Where do I find my search appearances?
Go to the Analytics section of your LinkedIn profile and open Search appearances. This shows how often your profile appeared in LinkedIn searches and provides information about the people finding you, including details such as their job titles and companies.
How far back does LinkedIn analytics go?
It depends on the data. Discovery and social engagement counts for most content types are available for 1,000 days, members reached for 400 days, and demographic breakdowns for 180 days. Video analytics are available for 180 days, while article and newsletter analytics remain available for two years.
How often should I check my LinkedIn analytics?
A weekly review is usually enough for post performance, giving your content time to gather impressions and engagement before you assess it. A monthly review can then cover broader trends such as follower growth, search appearances, audience demographics, and business conversations generated through LinkedIn.
Which LinkedIn metrics should I track?
The metrics you track should reflect what you want LinkedIn to achieve. For brand awareness, that may include impressions and members reached. For lead generation, profile views, link engagements, inbound messages, and conversations with relevant prospects may be more useful.
Can I export my LinkedIn analytics?
Yes. LinkedIn allows you to export combined post analytics and audience analytics to an .xlsx file. Periodic exports can be useful if you want to maintain your own historical record and compare performance over longer periods.
LinkedIn Analytics: Metrics to Track and How to Use Them
- Treat your personal profile and Company Page as separate analytics dashboards because they serve different purposes and should be measured differently.
- Look beyond reactions to comments, saves, sends, profile activity, and other signals that show how people responded to your content.
- Treat any third-party published benchmarks as reference points rather than fixed targets, and use your own historical median as a baseline.
- Check who is engaging, particularly their roles, seniority, and companies, to see whether your content is reaching the audience you want.
- Connect LinkedIn activity to conversations and business outcomes so you can see which topics and interactions lead somewhere outside the platform.
- Review your numbers weekly for post-level patterns and monthly for broader changes in follower growth, search appearances, and audience demographics.
- Export important analytics periodically if you want to maintain a longer-term record of your performance.


Insights Hub
Employer Branding on LinkedIn
The Best Time To Post on LinkedIn In 2026